
Piper PA-24-250
Aircraft Manufacturer: Piper
Model: PA-24-250
About the Piper PA-24-250
The Piper PA-24-250 holds the 9th-largest active fleet in Piper's lineup, and more than 1,000 aircraft remain on the U.S. civil registry. The PA-24-250 accounts for about 3% of Piper's total active registered fleet.
About half of all U.S. registry records ever held for the PA-24-250 have been deregistered.
Within its cohort of same type, engine class, and seat range, the PA-24-250 records a higher accident rate than about 60% of comparable types, where a higher percentile means a higher accident rate. The rate works out to about 4 accidents per 1,000 aircraft-years over the type's own FAA-registration exposure. Of the 109 recorded accidents behind that figure, 28 were fatal.
Aircraft Details
| Manufacturer | Piper |
|---|---|
| Manufacturer Serial Number | 7102404 |
| Model | PA-24-250 |
| Category | Land |
| Aircraft Type | Fixed wing single engine |
| Cruise Speed | 135 MPH / 117 knots |
| Weight | Class 1 (Up to 12,499 lbs gross take off weight) |
| Engine Type | Reciprocating |
| Number of Engines | 1 engine |
| Number of Seats | 4 seats |
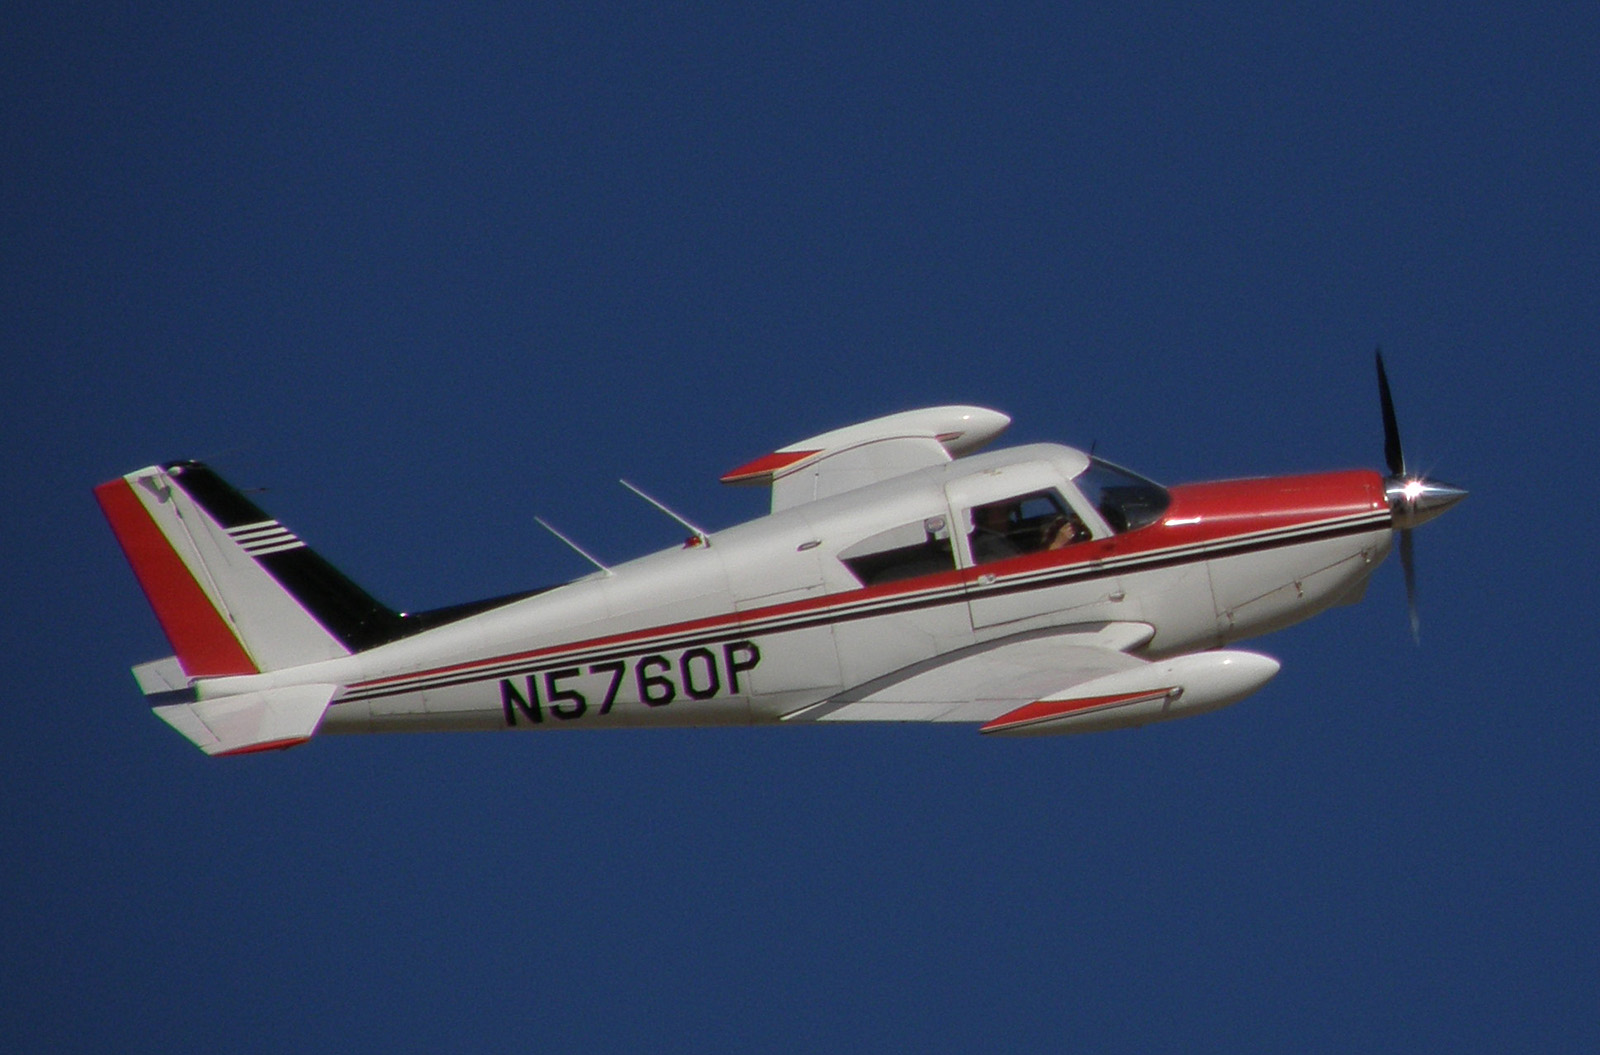 Photo: Alan Radecki Akradecki —
cc-by-sa-4.0
via Wikimedia Commons
Have a personal photo of the Piper PA-24-250? Contact us.

Safety Analysis
Composition of NTSB accident records for this model in general-aviation operations (FAR Part 91 and 137), based on NTSB data as of May 1, 2026. It's a breakdown of recorded accidents rather than a safety rating, and types with significant non-GA operation (such as Part 135) may be under-represented.
Accidents are identity-confirmed against FAA registration records (two independent sources).
75 exact, 33 recovered, 1 provisional
MethodologyTotal recorded general-aviation accidents within the analyzed period.
28 fatal accidents.
25.7% of recorded accidents were fatal.
Active aircraft fleet size contributing to the exposure data.
25,860
Aircraft-years of FAA registration exposure (2008–present).
Within its peer cohort
Within this model's peer class (same aircraft type, engine class, and seat range), comparison of its share of recorded NTSB accidents to its share of FAA registration exposure (aircraft-years since 2008).
This is a share comparison, not flight-hours adjusted, so a model flown more per airframe than its peers will show an accident share above its exposure share even if its per-hour safety is average. Methodology →
Accidents by year
Recorded NTSB general-aviation accidents per calendar year, derived directly from the NTSB accident database. Each bar shows the accidents that occurred in that year. Methodology →
Investigations take 12–36 months to finalise, so the trailing years come in incomplete. Recent years are adjusted upward for that lag. Observed counts show as solid bars, the lag-adjusted estimate shows hatched.
Phase of flight
Which phase of flight each accident occurred in, as coded by the NTSB. Most accidents happen in the phases where most flying time is concentrated, so this isn't a measure of which phase is most dangerous.
Finding category
Top-level NTSB cause category, from the coded investigation findings. An accident often has more than one finding, so totals here can exceed the recorded accident count.
Injury severity
NTSB classification of the worst injury in each accident: None, Minor, Serious, or Fatal. Each accident counts in exactly one severity.
Operating-rule mix (all parts): 091 (109)· NUSN (2)· UNK (1)
Recorded Accidents
All 109 recorded NTSB general-aviation accidents for this model, most recent first.
| Date | Location | Tail | Damage | Highest injury | Phase of flight | Finding categories |
|---|---|---|---|---|---|---|
| Black Canyon City, AZ | N7471P | Substantial | Fatal | Enroute | Personnel issues, Environmental issues | |
| Wasilla, AK | N7440P | Substantial | None | Enroute | Aircraft, Personnel issues | |
| San Diego, CA | N7690P | Destroyed | Fatal | Enroute | Aircraft, Personnel issues, Environmental issues | |
| San Luis Obispo, CA | N8215P | Substantial | None | Landing | Personnel issues, Environmental issues, Aircraft | |
| Mineral Wells, TX | N5451P | Substantial | None | Prior to flight | Aircraft, Personnel issues | |
| Yuma, CO | N5476P | Substantial | Fatal | Maneuvering | Personnel issues, Environmental issues, Aircraft | |
| Pine Bluff, AR | N6265P | Destroyed | None | Landing | Not determined | |
| Vernal, UT | N6235P | Substantial | Minor | Enroute | Personnel issues, Environmental issues | |
| Placerville, CA | N7988P | Substantial | None | Landing | Not determined |
Page 5 of 5 (showing accidents 101–109 of 109).